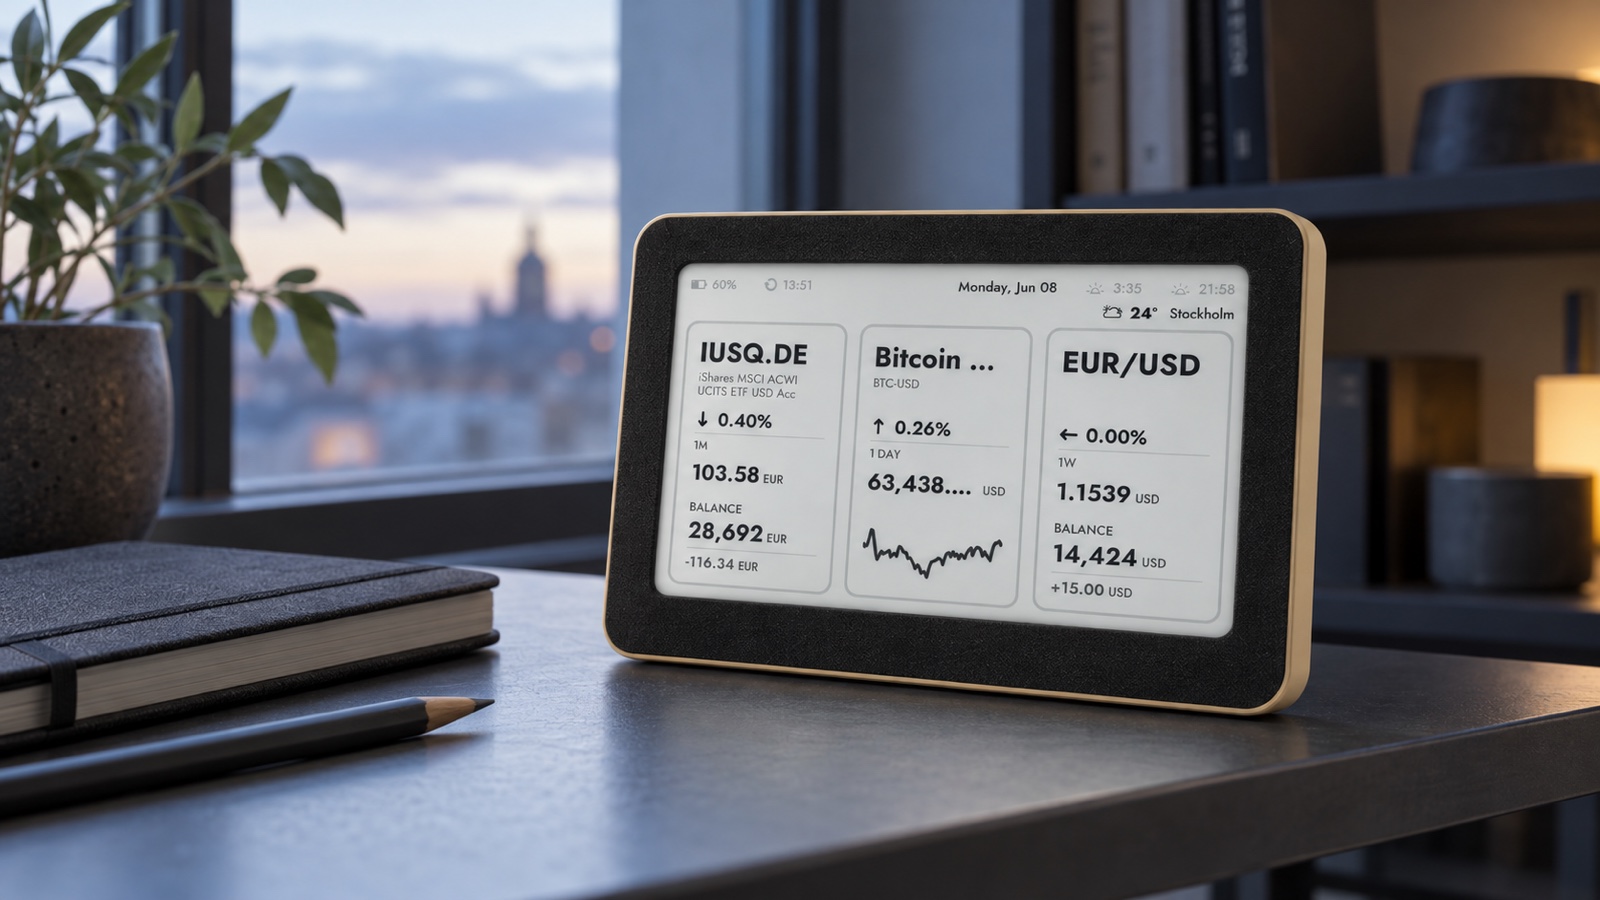
A portfolio value display can answer a legitimate question: roughly how much are the selected holdings worth now? But an always-visible total can also expose private information, blur deposits with investment performance and turn a long-term account into a number you notice every time you enter the room. The best setting is not automatically the most detailed one.
The practical answer is to choose the smallest view that supports a defined review. A total or selected holding value can be useful in a private office. Percentage-only can preserve scale while hiding account size. Ticker-only can keep public market references visible without showing personal balances. In some homes the right market view is no market view at all.
Choose the number by its job, audience and time horizon—not because the layout has space for it.
Start with the job, not the biggest number
Three common display modes answer different questions. A ticker price asks what one instrument is quoted at. A percentage change asks how a defined value moved over a stated interval. A portfolio or holding value multiplies market prices by quantities and may combine several positions. Those views are related, but they are not interchangeable.
- Total or holding value: useful for scale, but personal and sensitive to cash flows, currencies and coverage.
- Percentage-only: hides the account size, but needs a clear time range and still says nothing about why the value moved.
- Ticker-only: shows external market references and reveals the least about personal finances, though it offers less portfolio context.
- No market data: appropriate when visibility creates pressure or the room has no genuine market-related job.
Write one sentence before configuring the screen: “I use this display to…”. “Notice the monthly direction of three holdings” points to a different layout from “check whether a transfer reached my account”. The second task belongs in the broker account and statement, not on a passive home display.
When a value earns its place
A value can be useful when it supports a planned, infrequent review. For example, someone may use a private desk display to keep a selected long-term holding in scale, then open the broker account on a scheduled date to review contributions, allocation and statements. The visible number is a cue, not the complete record.
It works best when the coverage is explicit. Is the screen showing one account, several accounts, only the three selected symbols, or an estimate in one currency? Does it include cash, bonds, pensions, unlisted assets or liabilities? A large figure without those boundaries can look authoritative while describing only part of the financial picture.
Why a total can mislead
A change in account value is not the same as investment return. Deposits, withdrawals, dividends, fees, transfers, currency conversion and changes in market prices can all affect the number. Investor.gov’s guide to brokerage statements separates these flows because the ending value alone does not explain what happened during the period.
Investor.gov: understand changes in a brokerage account statement →
The same caution applies to an ambient estimate. If the display covers only selected positions, it should not be described as net worth or a complete portfolio. If quantities were entered manually, they must be updated after purchases, sales, transfers or corporate actions. A value in euros may also move because an asset or account is denominated in another currency.
Percentage-only is more private, not context-free
A percentage can remove the most obvious disclosure: the size of the account. That is why percentage-only is a real interface choice in financial widgets; Robinhood, for example, documents a mode that hides the dollar portfolio value while displaying percentage change. The existence of the option does not make it universally better, but it confirms that privacy and scale are separate decisions.
Robinhood support: percentage-only portfolio widget mode →
Ask what the percentage measures. Is it today, since the previous close, one month, since purchase or a user-selected chart range? Is it price return or a broker-calculated account return after cash flows? Two percentages can be correct and still describe different intervals or formulas. Put the range beside the number and avoid treating a short move as evidence about a long-term plan.
Ticker-only is the lowest-disclosure market view
A ticker-only screen can show a share, ETF, currency pair, index, cryptocurrency or metal reference without revealing quantities or balances. It still exposes interests and habits—someone may infer what you follow—but it does not publish the size of a holding to family members, visitors or a camera in the room.
This mode is strongest when the watchlist is short and intentional. One to three familiar symbols can answer a recurring question; a dozen tiny cards usually signal that the task has become analysis rather than orientation.
Build a calm one-to-three-symbol watchlist →
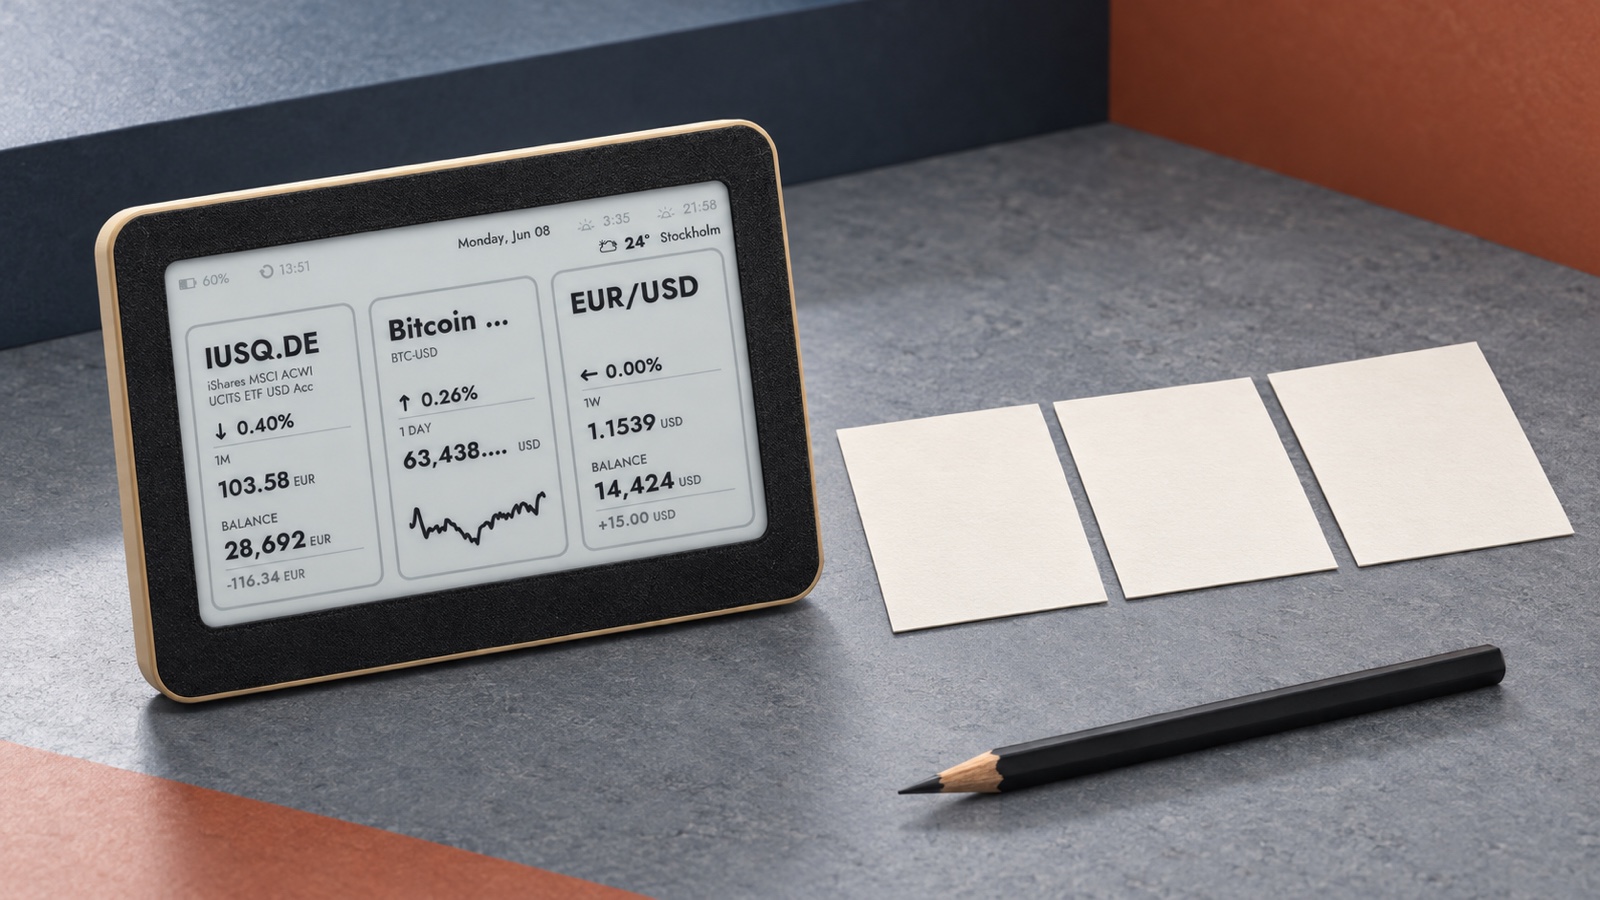
See the Brisa Daylo market display with optional holding values →
The room changes the answer
- Private office: a selected holding value may be acceptable if the door, windows, video-call camera and photographs do not expose it unexpectedly.
- Shared family room: percentage-only or ticker-only is usually easier to justify because everyone sees the screen but not everyone needs the balance.
- Hallway, kitchen or workplace: assume guests, contractors, children and cameras may see it; avoid personal financial values.
- Street-facing window or short-term rental: use public market references or another non-financial layout entirely.
Test the sightline at the real reading distance and after dark. Also check what appears in a wide-angle meeting camera or a casual photograph. Privacy is not only an account setting; it is the combination of content, type size, placement and audience.
Visibility can change the rhythm of checking
Research on myopic loss aversion studies how loss sensitivity can interact with frequent evaluation. An NBER field experiment with professional traders found behaviour consistent with this mechanism when price information arrived at different frequencies. That is evidence about a specific setting, not proof that every person will react to a home display in the same way.
NBER: field evidence on information frequency and myopic loss aversion →
The SEC’s investor education office also summarizes behaviours that can undermine performance, including active trading, momentum chasing and noise trading. A display cannot cause or cure those behaviours by itself. It can, however, be designed to avoid suggesting urgency: no alerts, no flashing colour, a limited watchlist and a review rhythm decided before the market moves.
Investor.gov: behavioural patterns that can undermine investment performance →
Orientation is not reconciliation or execution
A passive e‑ink market display is for orientation. It cannot replace a statement that records transactions, deposits, withdrawals, cash, fees, income and the full set of holdings. It also cannot replace current order information when timing matters. Market data may be delayed, periodically refreshed or retained while a market is closed.
Use the screen to notice a question, then move to an appropriate source. Verify the symbol, venue, currency, timestamp and range. For account accuracy, compare the broker statement and confirmations. For a trade, use the regulated account’s current quote and order controls—not the value left on an ambient screen.
Read prices, units and timestamps accurately across stocks, ETFs and metals →
Plan the placement and role of a home stock ticker display →
Choose the mode with six questions
- What exact question should one glance answer?
- Who can see the display in person, through a window or on camera?
- Does the value cover the whole account, selected positions or a manual estimate?
- What period, currency and data source define the change?
- What action—if any—should follow the glance, and where should that action happen?
- Would hiding the balance or removing market data make the room calmer without losing anything useful?
Review usefulness and privacy once a month
A monthly review is frequent enough for the display itself. Confirm that quantities still match the intended estimate, symbols still represent the right instruments, ranges are labelled, and the physical sightline has not changed. Remove a value when it creates repeated checking without supporting a planned decision.
- Keep: the number answers a stable question and its audience is appropriate.
- Hide: the task remains useful but the account size does not need to be visible.
- Simplify: replace holding values with percentage change or selected tickers.
- Move: the information belongs in a private office rather than a shared room.
- Remove: the screen adds pressure, ambiguity or habit without practical value.
What Brisa Daylo can show
Brisa Daylo’s current market layouts can show up to three supported Yahoo Finance symbols, including stocks, ETFs, currencies, indices and cryptocurrencies where suitable symbols are available. Entering a quantity for a selected symbol lets the layout calculate and show that holding’s value and change; leaving the quantity empty keeps a simpler price, percentage and sparkline view. This is a manually configured display estimate, not a synchronized brokerage statement.
The data refreshes periodically rather than as a live trading feed. That makes the device suitable for a quiet reference point and unsuitable for order timing, account reconciliation or advice. Use only symbols you understand, keep personal values out of shared sightlines and verify anything important in the source account.
Explore Brisa Daylo layouts for markets, weather and calendars →
Compare a passive e‑ink view with an interactive tablet or smart display →
The best answer may be less information
A useful ambient display does not prove its value by showing the largest number available. It earns its place by answering one stable question with the least disclosure and least ambiguity. In a private, deliberate review that may include a holding value. In a shared room it may be a percentage or three public tickers. If none of those helps, choose weather, a calendar or a blank shelf instead.
This article is for general information about display design and privacy. It is not financial, investment, tax or legal advice, and it does not recommend any security, allocation, transaction or monitoring frequency.
Portfolio values on an ambient display: quick answers
Should an e-ink market display show my total portfolio value?
Only when the number has a clear purpose, the screen is private and you understand what the total includes. A percentage-only or ticker-only view is often more suitable in a shared or visitor-visible room.
Does percentage-only mean the information is anonymous?
It hides the account size, but it can still reveal which assets you follow and how they moved. The percentage also needs a defined period and denominator to be meaningful.
Can a display replace a brokerage account statement?
No. A brokerage statement includes holdings, cash flows, fees, transactions, income and other account details. An ambient display is a simplified reference and may use delayed or periodically refreshed market data.
Does Brisa Daylo connect to a brokerage account?
The current Brisa market layout uses selected market symbols and manually entered quantities to calculate visible holding values. It is not a broker statement or order-entry service.
Is this article financial advice?
No. It explains display and privacy choices. It does not recommend an investment, allocation, trading frequency or response to market movements.