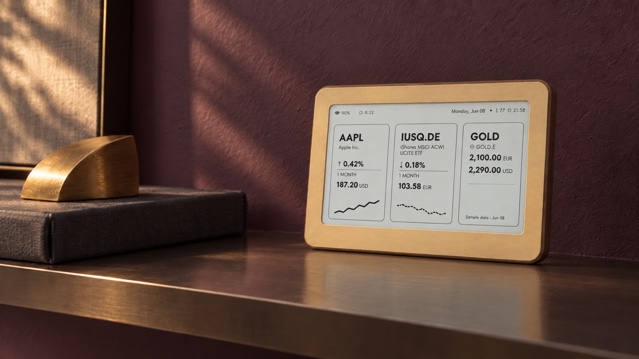
A stock, an exchange-traded fund and an ounce of gold can sit side by side on a market display, yet the three numbers do not mean the same thing. A share price refers to an ownership interest in one company. An ETF quote is the market price of a share in a pooled portfolio. A precious-metal quote is usually a benchmark or wholesale reference stated in a particular currency and unit. The useful habit is simple: read the label, unit, timestamp and source before reading the movement.
That makes a home e-ink display good for orientation and poor for urgency. It can keep a few familiar references visible without opening a finance app, but it cannot explain a move, assess value or replace current execution data. This guide is about interpreting the screen accurately, not constructing a portfolio or predicting what any asset will do next.
Start with four labels: instrument, unit, time and source
Before comparing two prices, confirm that they describe the same thing. The symbol should identify the exact security, fund, index, currency pair or metal reference. The unit may be one share, one troy ounce, a gram, an index point or a currency pair. The timestamp tells you whether you are seeing a recent trade, a delayed quote, a previous close or a value retained while the market is shut. The source tells you whose definition and feed you are relying on.
A neat three-card layout can make unlike numbers look more comparable than they are. A 1% move in a single-company share, a diversified ETF and silver does not represent the same risk, cause or economic exposure. Treat the common visual format as a reading aid, not evidence that the assets belong in one analytical category.
A stock price is the price of one ownership unit
Investor.gov describes a stock as an ownership position in a corporation and a claim on a proportional share of its assets and profits. The displayed market price is what buyers and sellers recently agreed for one share on a particular venue; it is not the value of the whole business. Share count, debt, cash, earnings and expectations all sit outside that single number.
Investor.gov: what a stock represents →
Even the symbol needs context. Companies can have multiple share classes, the same name can trade on different exchanges, and depositary receipts or secondary listings may use another currency. If a quote looks surprising, check the company name, exchange suffix, share class and currency before drawing a conclusion.
An ETF price belongs to a tradable share in a portfolio
An ETF pools money into a portfolio that may hold shares, bonds, commodities or other assets. Its exchange price is the price of one ETF share, not a direct reading of every holding and not necessarily the index level in its name. Two funds tracking a similar theme can differ in holdings, weights, currency treatment, fees, replication method and tax structure.
The SEC’s 2025 investor bulletin notes that ETF shares trade at market prices and those prices can be above or below net asset value, the per-share value of the underlying portfolio. In ordinary conditions the gap may be small, but it is still a different concept. When evaluating an ETF, read its official documents and current data rather than inferring quality from the screen price or from a one-day percentage change.
SEC Investor Bulletin: how ETF market prices and NAV differ →
Gold and silver quotes are references, not shelf prices
A precious-metal number needs at least a metal, weight, currency and market convention. Financial media commonly quote gold and silver per troy ounce in US dollars, while a local dealer may show grams or kilograms in euros, pounds or złoty. Converting weight and currency can reconcile part of the difference, but it does not turn a wholesale reference into the final price of a bar or coin.
LBMA explains that prominent precious-metal benchmarks are administered prices for gold, silver, platinum and palladium. Its guide to “the price” also distinguishes widely reported wholesale Loco London quotations from retail transactions. Fabrication, brand, size, distribution, insurance, tax, delivery and a dealer’s spread can all affect what a physical product costs.
LBMA: precious-metal benchmarks and their conventions →
LBMA: why a quoted metal price is not a retail price →
Gold and silver also should not be treated as automatic signals about inflation, safety or the next market move. They have different industrial uses, liquidity, volatility and investor demand. A rising price tells you that the quoted market moved over the stated period; it does not, by itself, identify the cause or the correct response.
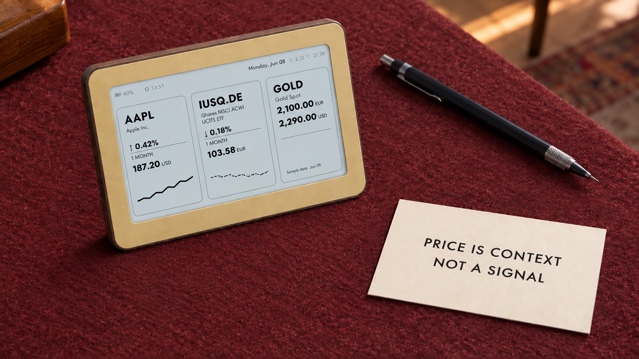
See the Brisa Daylo e-paper market display on Etsy →
The latest number may not be an executable price
A screen may show the last trade, a midpoint, a previous close or a delayed value. An actual order interacts with bids and offers, and the result can move while an order travels to the market. FINRA warns that the quote visible when an order is entered may differ from the execution price because of time, system conditions and market volatility.
FINRA: quotes, order types and execution-price risk →
Closed markets create another trap. A stock or ETF can keep yesterday’s closing value while related futures, currencies or overseas markets continue moving. A metal feed may follow another timetable. When two cards have different timestamps, their percentage changes do not describe the same interval. For any time-sensitive decision, move from the ambient display to a current, appropriate market source.
A sparkline shows a shape, not an explanation
A small sparkline is useful for noticing direction and unusual movement, but its appearance depends on the selected period and vertical scale. A steep-looking line can represent a small percentage change, while a flat-looking line can hide a larger move when the range is wide. Without a labelled interval, baseline and scale, compare shapes cautiously.
The line also omits dividends, fund distributions, fees, spreads, currency effects and the news or market structure behind the move. Use it to formulate a question such as “what changed?” rather than an instruction such as “act now”.
What belongs on a calm three-item display
Choose references you already understand and can name precisely. One company you follow professionally, one broad fund you already research and one relevant commodity can be a useful educational mix, but it is only an example of categories—not a suggested allocation. Another person may need three exchange rates or no market display at all.
- Write the full name, exchange or benchmark behind every symbol.
- Record the quote currency and unit; for metals, distinguish troy ounces from grams.
- Know whether the change is intraday, since the previous close or over another period.
- Check whether the feed is live, delayed or periodically refreshed.
- Decide what question each card answers before placing it on the screen.
- Remove any symbol that creates pressure without adding useful context.
Build a three-item watchlist around questions rather than excitement →
Plan the placement and viewing rhythm of a home market display →
Five checks before reacting to a price
First, verify that the symbol is the intended instrument, share class or benchmark. Second, verify the unit and currency. Third, compare timestamps and market hours. Fourth, open the primary document or an appropriate regulated source to understand what changed. Fifth, decide whether the information is even relevant to a decision you had already planned. If any step is missing, the calm response is to gather context—not to infer a story from the colour or direction of a number.
Where Brisa Daylo fits
Brisa Daylo is a matte 7.5-inch e-ink display for periodic reference. Its market layouts can show up to three supported Yahoo Finance symbols, including stocks, ETFs, currencies and crypto where a suitable symbol is available. Separate precious-metal references cover gold, silver, platinum and palladium using GOLD.DE data. Layouts can also show sparklines and an optional portfolio value.
It is not a trading feed, broker, research terminal or recommendation engine. Symbols and third-party data coverage can change, and a retained e-ink image can become stale if connectivity fails. Check the timestamp, confirm the instrument and use an appropriate current source before any financial action. The product and source descriptions in this article were checked on 15 September 2026.
Explore Brisa layouts for markets, weather and calendars →
For general information and personal reference only. This article is not financial, investment, tax or legal advice and makes no promise about returns or future prices.
Questions about market prices on an e-ink display
Is the gold price on a screen the price of a physical coin or bar?
Usually not. A quoted gold price is commonly a wholesale or benchmark reference for a stated weight and currency. A dealer’s final retail price can include fabrication, distribution, tax, shipping and a buy-sell spread.
Can an ETF market price differ from its net asset value?
Yes. ETF shares trade on an exchange at market prices, while net asset value measures the underlying portfolio. The two can differ, especially during volatile or less liquid trading.
Can I use an e-ink market display for trading?
No. A periodically updated home display is for orientation, not execution. Confirm current quotes, product documents, fees and order details with an appropriate regulated source or broker.
Why can the same asset show different numbers?
Check the instrument or benchmark, exchange or venue, currency, unit, timestamp and data source. Foreign-exchange conversion, market hours, delays and retail premiums can all change the number you see.